
About me
My passion is translating complex geospatial problems into digital media and applications that spark imagination. Products I specialize in are Interactive Maps, Infographics, Dashboards, and User Interfaces. Analyzation and data interpretation is one of my strengths. This combined with my interest in modern day problems have allowed me to work on very interesting projects. I have gained experience during previous internships and various projects during my education.
Scripting languages
Python | R | SQL | C#
HTML | CSS | JavaScript
Tools
ArcGIS Pro | QGIS | Adobe Illustrator
Adobe XD | GitHub | Google Earth Engine
My work so far
Interactive maps
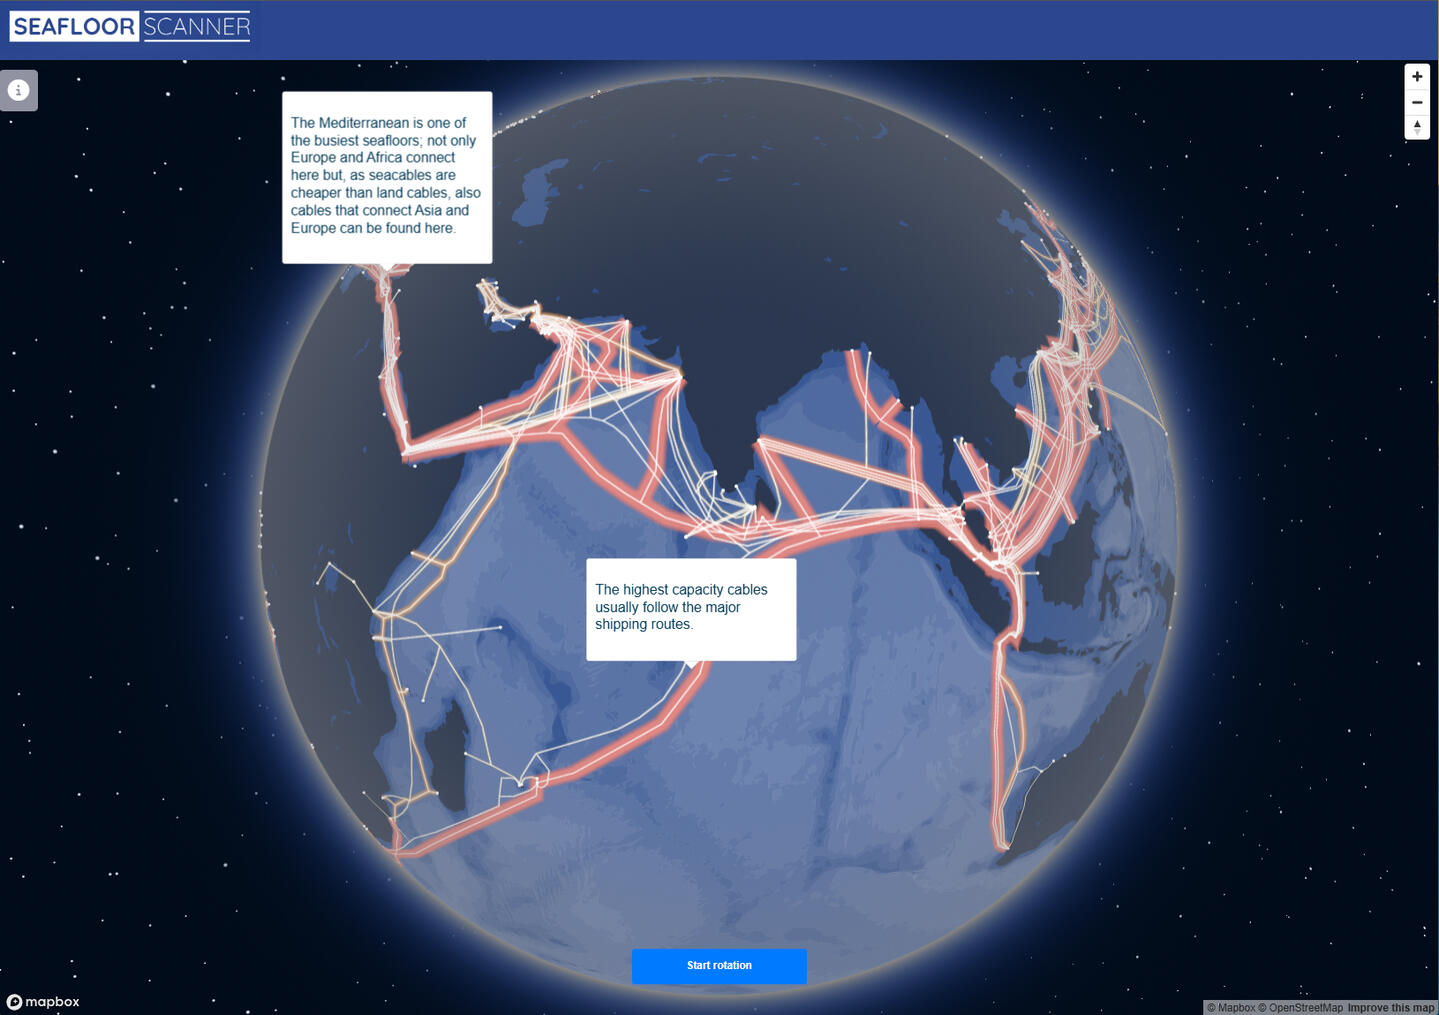
SeafloorScanner is an interactive map of undersea cables, designed to visually represent the global network of submarine communication infrastructure.The purpose of the visualization is to convey the complexity and global extent of the undersea cable network in a clear and interactive manner. By enabling users to explore the data at their own pace, the visualization encourages engagement of a system that is often invisible yet vital to global communication.A interactive version of SeafloorScanner can be accessed via this Link or by clicking on the image.
Infographics
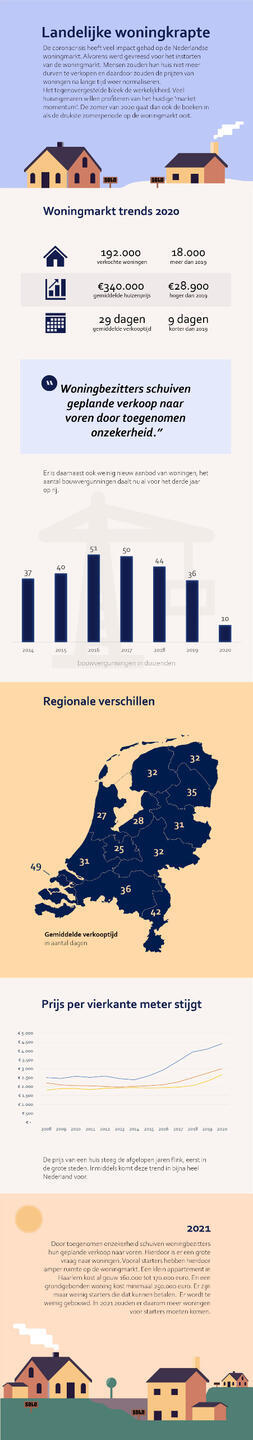
This geo-visualization product is a long-form infographic that visualizes key trends in the Dutch housing market.The goal of the visualisation is to serve as an informative visual tool for homeowners and prospective buyers, helping them understand spatial patterns and trends in housing market.
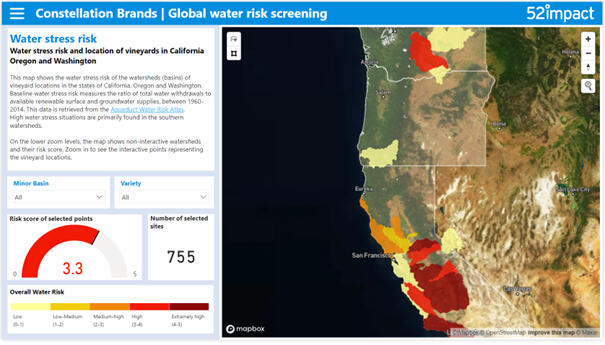
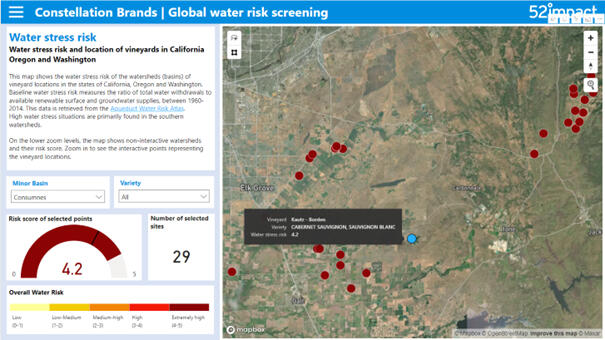
Dashboards
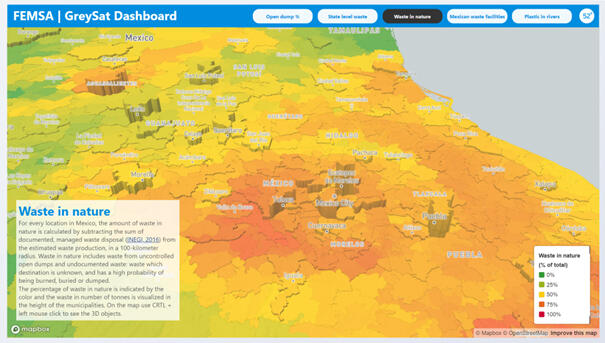
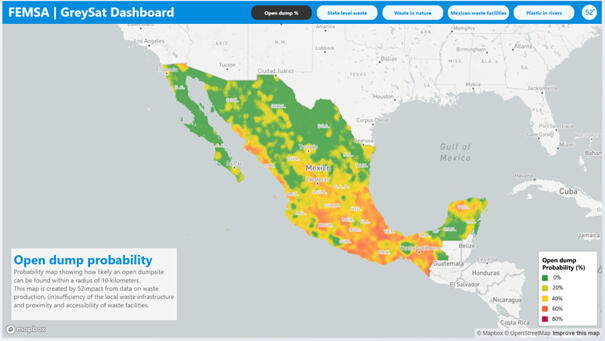
Two dashboards created during my internship at 52impact. The top images are a dashboard showing waste in nature in Mexico on a municipal level and on a 10x10km raster scale.
The bottom two images are from a water risk dashboard for vineyards and plantations in California, Oregon and Washington.
Game design
This video shows DroneSimulator, this is unity based game where users can fly around real locations using a drone.